5 September 2026 · Community research update
We now have an observed weather case, a first test of an actual forecast, and a reproduced reference calculation from an established dispersion model. The concentration explorer remains illustrative. The strongest finding is that a forecast can look reasonable at the airport while missing the direction change farther down Howe Sound.
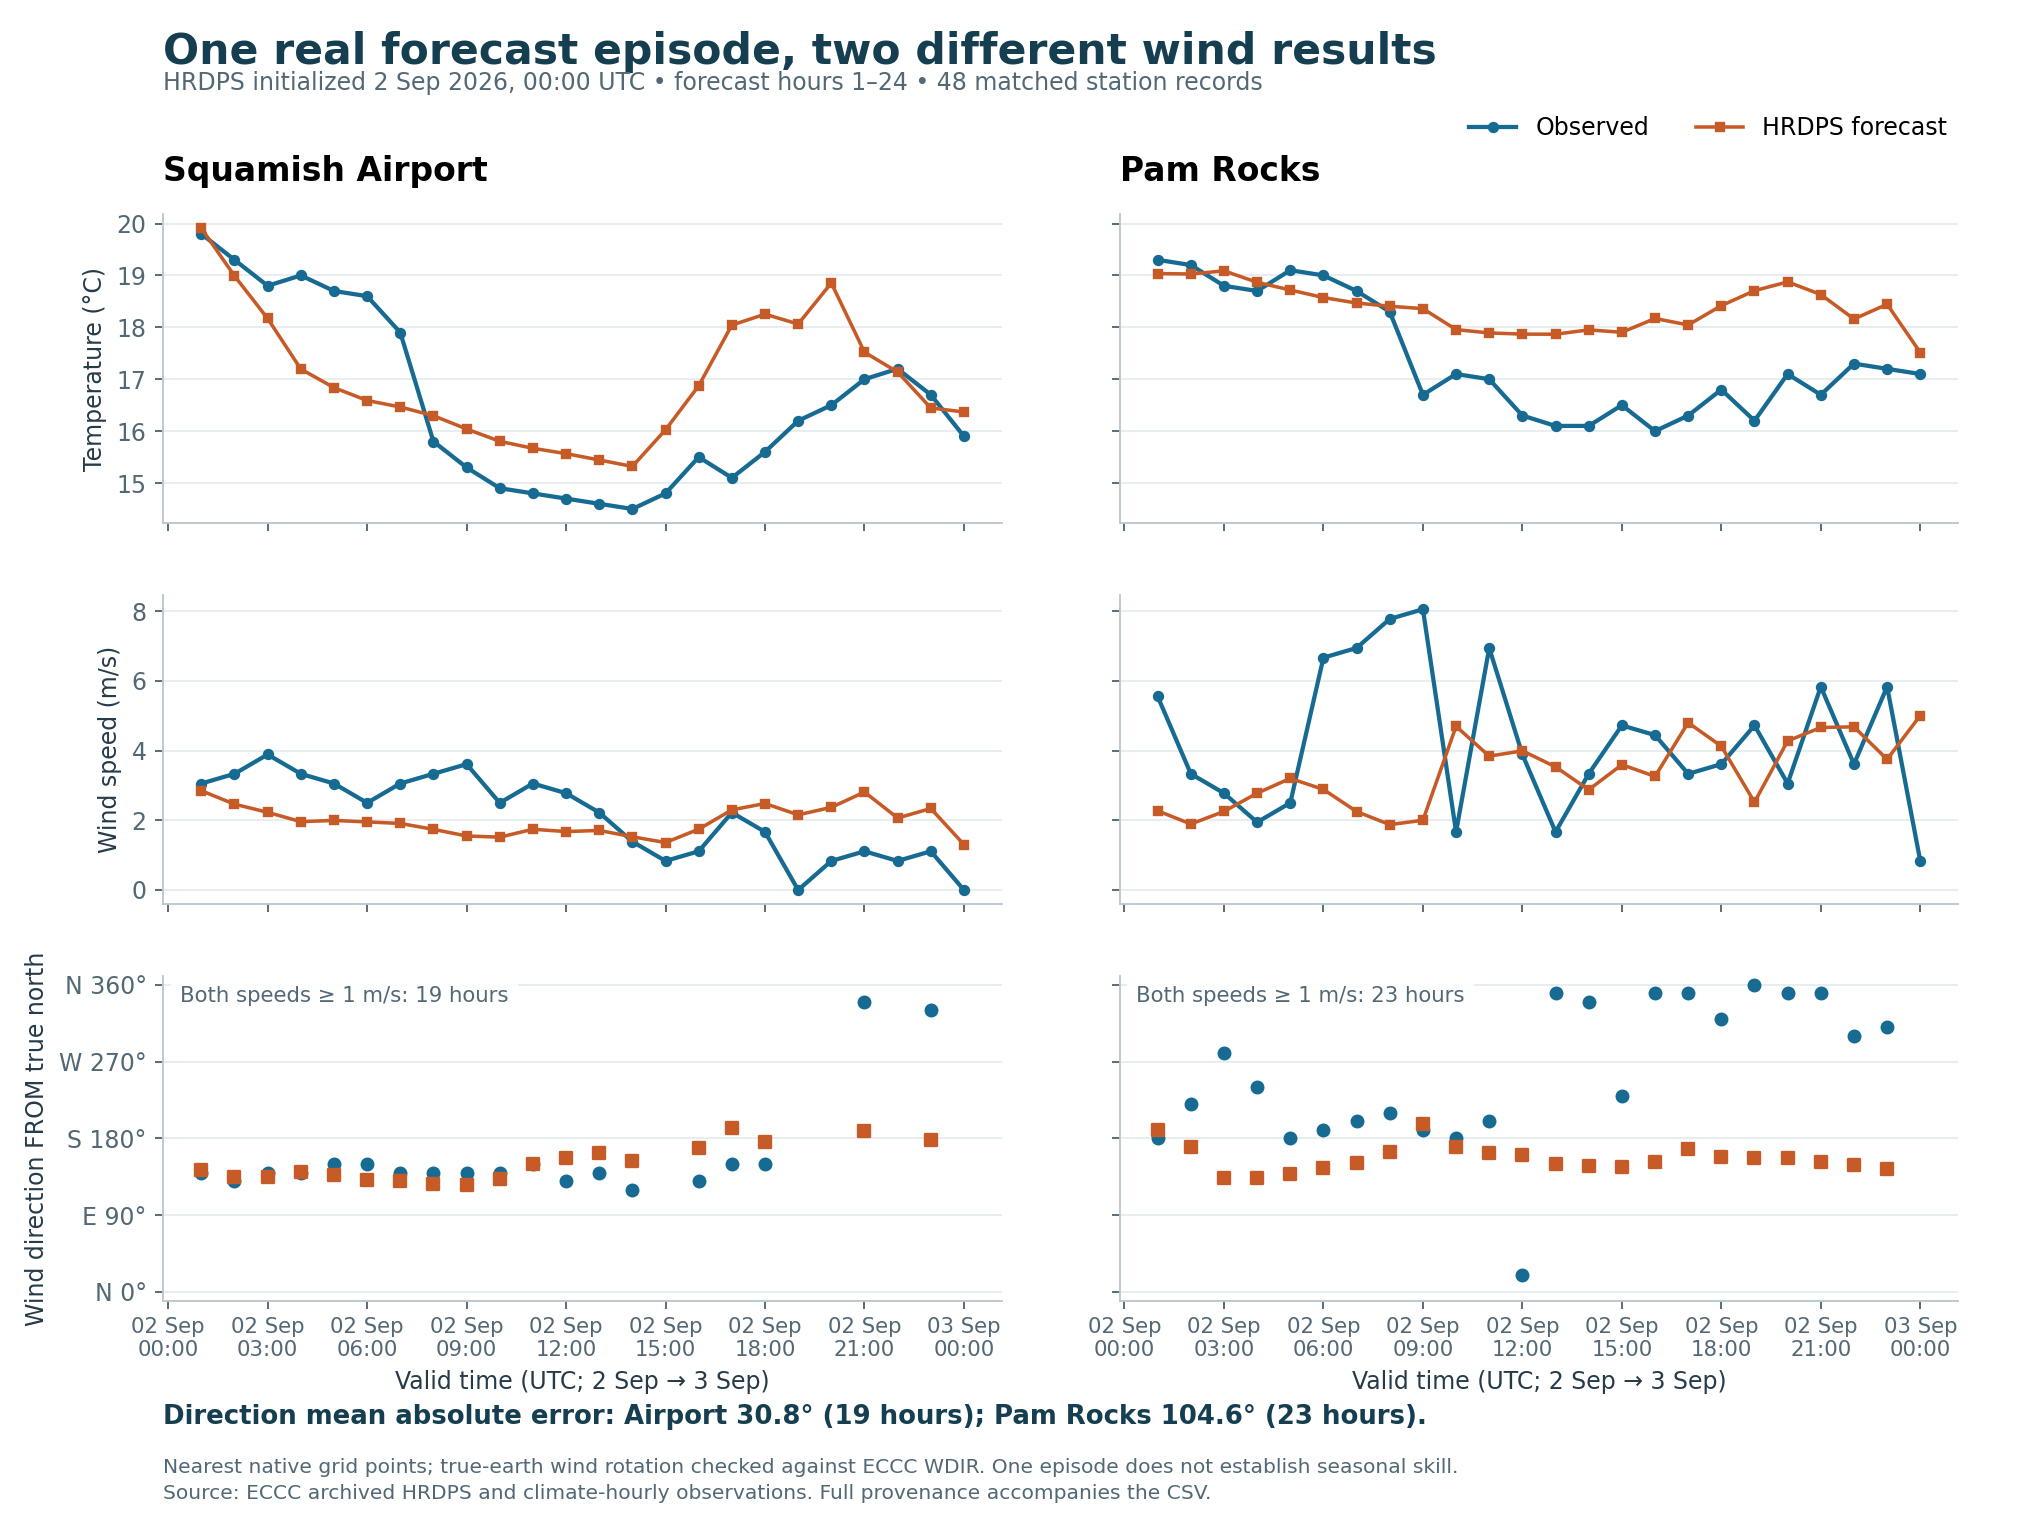
We compared ECCC’s HRDPS forecast initialized at 00:00 UTC on 2 September 2026 with the following 24 hours of reported weather at Squamish Airport and Pam Rocks. This is one episode, selected for available files and observations before examining its errors.
| Finding | Why it changes the work |
|---|---|
| Average wind-direction error: 30.8° at the airport; 104.6° at Pam Rocks | The forecast missed much of Pam Rocks’ observed direction change. A similar error near a flare could send the simulated plume toward a different community. Direction scores exclude hours when either wind speed is below 1 m/s: 19 airport and 23 Pam Rocks hours remain. |
| Nearest Woodfibre proxy forecast point: 1.15 km west, at 568 m model elevation | The shoreline proxy is approximately 9 m in the legacy terrain check. This forecast point cannot be treated as representative source-site wind. A finer-looking map would not resolve that mismatch. |
| Two sampled pressure levels fall below the forecast model’s ground near the proxy | They are excluded as atmospheric samples. The remaining sparse profile cannot identify an inversion’s depth. |
The full comparison retains units, station locations, forecast initialization/valid times, model terrain, wind rotation and limitations. An independent processing audit reconfirmed all 48 observation joins, the wind-error arithmetic, all 92 original forecast-file hashes and the below-ground exclusions. These checks establish consistent processing, not environmental accuracy. Audit
An earlier three-day observed sample also shows substantial spatial variation. At 06:00 PST on 2 May 2025, Pam Rocks reported 9.4 m/s while Squamish Airport reported calm. The observed-case report documents coverage and the limits of interpreting those differences.
We also corrected a calendar boundary in the air-monitor sample. B.C. pollutant records are hour-ending averages, and a record labelled 24:00 belongs to the end of that calendar day. Six additional records now complete the timestamp coverage for 1–3 May; missing numeric readings remain missing. The processed file carries explicit UTC start/end times. This avoids shifting pollutant readings by an hour when assessing plume arrival. It does not establish a representative background or attribute any reading to Woodfibre.
We built AERMOD 26135 from EPA’s unchanged source and ran its official Martin’s Creek sample using supplied terrain and meteorological preprocessor outputs. The three main output files matched the EPA reference numerically at their printed precision: 11,026 numeric entries compared, maximum difference zero, after documented path, generated timestamp, whitespace and signed-zero normalization.
This verifies that this executable reproduces the supplied calculation. It does not test the preprocessors, select AERMOD as the final Howe Sound model, validate inversion/outflow behaviour, or supply Woodfibre emissions. The run’s 84 warnings and 72 informational messages also match the reference; they have been retained. Verification scope and evidence
The living research plan links the detailed data catalogue, emissions gap register and modelling roadmap. Two records-request drafts identify precise existing records and verified access routes. Nothing has been sent or submitted.
outputs/.The two weather samples describe different dates: the May observations are an initial historical data/timing exercise; the September case tests one actual forecast. Neither is a reconstructed Woodfibre flare event. Current community colour changes must continue to be described as illustrative scenario comparisons, not mapped health-risk predictions.