5 September 2026 · Research inputs
The verified Squamish Elementary record now supports candidate background concentrations for a dispersion study. We have calculated fixed values, NO₂ profiles by month and hour, and a complete, flagged ozone input series for a prospective 2025 calculation. An independent calculation from the native records agrees with the tables and every prepared ozone hour.
Background accounts for air pollution already present from sources outside the modelled release. Selecting it requires evidence about the monitor and intended modelling area. The current work prepares the values for that decision; it does not add them to the illustrative map.
2025 is the most recent full calendar year acquired. Earlier years are shown separately to make year-to-year variation visible. All six pollutants in all three years pass the original-data quarterly coverage check and the declared additional daily coverage check. No observation periods were removed or assigned to a source.
| Candidate for a detailed dispersion assessment | 2023 | 2024 | 2025 |
|---|---|---|---|
| PM₂.₅ · 24 hours · µg/m³ | 16.74 | 11.16 | 16.00 |
| PM₂.₅ · annual · µg/m³ | 6.01 | 4.69 | 5.76 |
| NO₂ · 1 hour · ppb | 19.60 | 17.85 | 22.09 |
| NO₂ · annual · ppb | 4.72 | 4.36 | 5.18 |
| SO₂ · 1 hour · ppb | 3.89 | 5.93 | 4.11 |
| SO₂ · annual · ppb | 0.23 | 0.25 | 0.34 |
The hourly gas candidates use annual percentiles of daily hourly maxima: P98 for NO₂ and P99 for SO₂. The PM₂.₅ daily candidate uses P98 of daily means. Annual candidates average the available hourly observations. These methods follow the general B.C. dispersion guidance with explicit conventions for missing data and percentile selection. B.C. guideline, §8.1.4, pp.71–72.
These inputs have a different purpose from the three-year station comparison with B.C. objectives. For example, 2025's hourly NO₂ candidate is 22.09 ppb, while the previously reported three-year objective statistic is 20 ppb. The annual PM₂.₅ background uses an hourly mean rather than the quarter-weighted objective method.
The more conservative screening method uses observed maxima for the matching averaging period. For 2025, those are 174.81 µg/m³ for 24-hour PM₂.₅, 27.30 ppb for hourly NO₂, and 6.95 ppb for hourly SO₂. The full candidate table preserves screening and detailed-assessment values for all six pollutants, in their native units. A calculated averaging-period value does not imply that a B.C. objective exists for every pollutant/period combination.
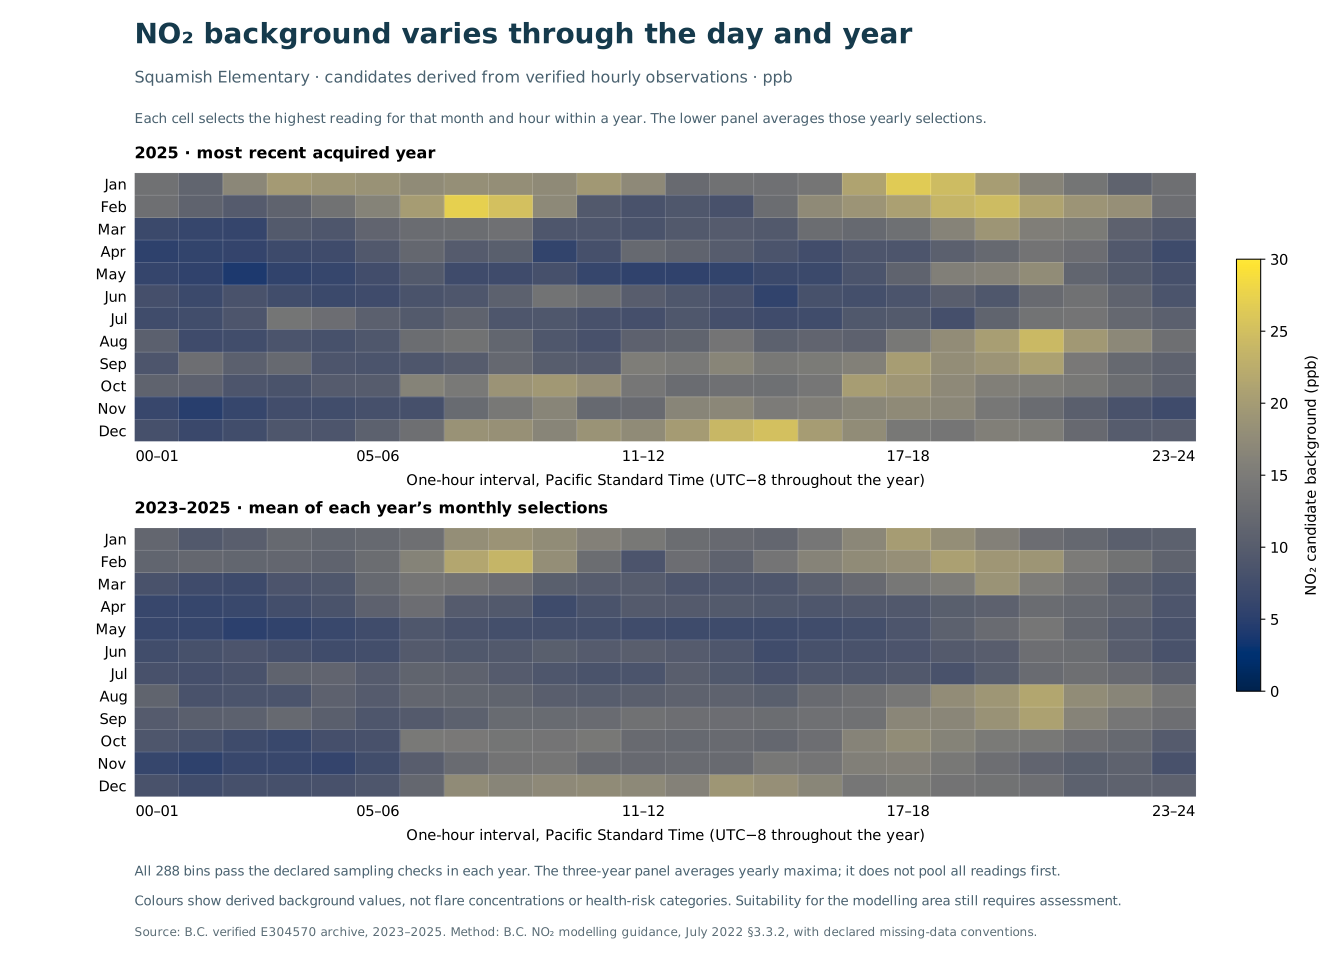
The 2025 monthly hour-of-day NO₂ candidates range from 4.05 to 27.30 ppb. The corresponding three-year candidates range from 5.21 to 23.66 ppb. Each monthly cell selects that year's maximum for the given clock hour; the multiyear table then averages the three yearly selections. All 288 monthly cells and all 24 annual hour-of-day cells pass the declared sampling checks in every year.
B.C.'s NO₂ guidance describes progressively refined background treatments. A time-varying background is added to each modelled hour before finding cumulative daily maxima and percentiles. It should not simply be added to an already-selected plume peak. The choice of method and dataset needs a justified modelling plan. NO₂ guidance, §3.3.2, pp.15–17.
The colour scale shows candidate concentrations, not health categories or a flare plume. Download the hour-of-day tables or the figure as SVG.
Ozone helps determine how emitted nitric oxide converts to NO₂. Its role in chemistry is separate from adding existing NO₂ to a model result.
The original 2025 ozone record contains 8,120 measured hours and 640 missing hours. Following the documented B.C. preparation approach, the separate candidate copy fills 369 isolated hours using their observed neighbours and 271 hours using that month's observed maximum. Every substitution records its method and donor observations. The longest original gap lasts 127 hours, spanning late February and early March; the monthly donor changes at the month boundary. NO₂ guidance, Appendix D, p.42.
The prepared file covers all 8,760 hours, with 7.3% substituted. Its mean is 18.13 ppb, compared with 17.27 ppb over the available observed hours; the two means cover different sets of hours. The maximum stays 60.22 ppb. Original observations are unchanged. Suitability as the ozone encountered by a Woodfibre plume still needs assessment. Download observed and prepared ozone together.
The official NAPS catalogue identifies Squamish Elementary as a general population exposure station at neighbourhood scale, and lists its inlet 4 m above ground. The workbook refers to Stations2024; its later publication date does not establish a history of unchanged inlet or instrument conditions. Its neighbourhood classification is not a mapped boundary of proven representativeness. NAPS station workbook and definitions.
Health Canada's 2022 floatel review comment described the town station as approximately eight kilometres from the project and recommended onsite monitoring to verify predictions. This supports obtaining local comparison data; it does not quantify a town-to-site concentration difference. EAO comment record, p.66.
The next selection work is therefore specific: obtain dated inlet and instrument configuration/QA records; compare simultaneous town and onsite pollution and weather; account for sources already included in a cumulative model; and identify changes expected before operation. Ozone representativeness needs its own assessment because local NO emissions can consume it. The station-context review documents these records and the outstanding questions.
All calculations use fixed PST and preserve native hour-ending dates. Daily statistics require 18 observed hours. The declared percentile method selects an observed order statistic without interpolation. As a method sensitivity, a linear-interpolated percentile gives 14.29 µg/m³ for 2025 daily PM₂.₅, compared with the primary 16.00 µg/m³. That difference illustrates why the calculation convention must be specified. Provider-rounded values are also retained as a separate sensitivity.
The protocol was frozen before calculation. Independent processing started from the exact native annual files and checked all fixed values, NO₂ cells, prepared ozone values, timestamps, eligibility and replacement sources. This verifies the calculations; it does not establish monitor representativeness or validate plume transport.
The existing research plan retains the priorities for flare engineering data, local vertical weather and a suitable evaluated dispersion model.